
CONDITION MONITORING
Smart Condition-Based Maintenance (CBM) - do more than identify defects
More and more companies are proactively monitoring their assets using at least one technology to provide early defect identification.
This makes up the core of condition monitoring – allowing you to identify and address defects early, before they compound and cause further damage, result in unplanned equipment downtime or compromise employee safety.
Beyond identifying defects, condition monitoring provides a tremendous amount of data that you can leverage to measure and improve your overall maintenance program effectiveness and asset health. This data is the key to unlocking a successful condition-based maintenance (CBM) program. For example, knowing the parts that fail the most can help you optimize the purchasing and inventory of spares.
Many business models follow a pattern like the slogan on the back of shampoo bottles: wash, rinse, repeat. The business version is to decide what you are going to do, put your plan into action and then check if it is working. You then start over, adjusting the plan based on the data and keep repeating that process to achieve continual improvement.
For this to be effective, you need data so that you can measure your effectiveness. For example, if you are repairing defects early, before they get worse, you should see your overall asset health improve over time. When you find those issues early, it takes less effort to repair defects – boosting the efficiency of your maintenance team.
Below, you can see a program where the company is seeing fewer new defects being identified as their assets become healthier. This type of trend clearly illustrates why investing in adding condition monitoring to more assets in your line beats just focusing on the most critical.
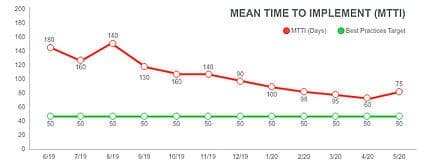
Another standard KPI for maintenance programs is Mean Time to Implement (MTTI). This is the time from when a defect is first noticed to when it is addressed via repair. Many of you are probably familiar with the Asset Failure Curve, or IPF curve, which shows the relationship between how early a defect is identified and the cost of fixing the problem.
Over time, a defect such as excessive vibration will compound and cause other defects – likely eventually leading to equipment failure. It is cheaper and faster to fix defects early, before this happens, when it is more likely to be something as simple as replacing a worn bearing. If you do find and fix repairs early, your maintenance team can be more efficient, and you will see a reduction in MTTI. This means your maintenance team has more time to address issues as they arise – reducing the risk that unattended defects will get worse.
Below, you can see a company whose investment in condition monitoring has allowed their MTTI to improve from fairly poor levels to close to their best practices target. This is a great example of using data trends to check how well your program is functioning. By watching these values monthly, you can measure the effect of your efforts early and often.
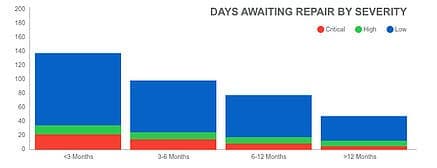
A third example key performance indicator (KPI) you can track is the number of days it takes to repair a defect versus the severity of the defect. A severe defect is more likely to cause other problems; therefore, you want to prioritize these issues.
The graph below appears to show that some critical issues have slipped through the cracks, as they have been waiting for over a year to be repaired. It could also indicate that the maintenance group is too busy to address everything.
However, the reality of this case is that a decision was made not to address a few of the critical defects immediately. The group used the data to drive the priority discussions and because these defects were in a non-critical line, they were prioritized lower. This is a great example illustrating that while data is great, it is not absolute. It should be used to foster discussions across your team as you create your execution plan.
In summary, to execute a successful program you need to do more than just identify defects. You need to make a list of your objectives and gather the data as you go to measure how you are doing. Use this data to discuss your progress with your staff quarterly. The data will allow you to have more purposeful discussions and allow you to make midcourse adjustments to create a more successful organization.
For additional reading on appropriate KPIs, check out the website of the Society for Maintenance & Reliability Processionals (SMRP.ORG). They have a Best Practices, Metrics and Guidelines section under Education discussing other metrics you can use to measure your program and adjust your goals.
Webinar
Operational Insight At Your Fingertips
Learn more about the SmartCBM® mobile app – giving you a view of equipment performance across your entire operation and granting you the freedom to execute workflows on your mobile device.
ABOUT ALLIED RELIABILITY
Allied Reliability provides asset management consulting and predictive maintenance solutions across the lifecycle of your production assets to deliver required throughput at lowest operating cost while managing asset risk. We do this by partnering with our clients, applying our proven asset management methodology, and leveraging decades of practitioner experience across more verticals than any other provider. Our asset management solutions include Consulting & Training, Condition-based Maintenance, Industrial Staffing, Electrical Services, and Machine Reliability.
Subscribe to our Blog
Receive the latest insights on reliability, maintenance, and asset management best practices.