
What is Preventive Maintenance?
Preventive Maintenance Defined
In the most theoretical sense, Preventive Maintenance (PM) is any maintenance activity that is performed to prevent a piece of equipment from failing.
All successful maintenance strategies require a good preventive maintenance plan that understands what failure modes can be prevented with regular maintenance and inspections of your critical assets.
Advantages of preventive maintenance include reduced costs, reduced downtime, improved safety, extended asset life, and increased production.
Preventive maintenance activities take several forms, but suffice it to say all forms of PM are intended to do one of two things:
- prevent the next occurrence of an equipment failure (only reengineering can possibly prevent it forever),
- or detect the presence of an impending failure.
Preventive maintenance has another characteristic in that it happens at a very predictable frequency. This is because PMs should be established to detect age-related or wear-out type failure modes. Therefore, preventive maintenance is any planned maintenance activity that is performed at a fixed interval.
The interval is usually based on operating time, such as every so many days, weeks, months, or years; however, the interval can also be based on throughput (aka meter-driven), such as every so many gallons of fuel burned, miles driven, or boxes produced. Either way, PM activities occur at fixed intervals. Therefore, any activity that is performed on-demand is reactive maintenance and not a PM activity which is a proactive maintenance activity. These characteristics of PM have been misinterpreted over the years resulting in preventive maintenance programs that look very different from one company to the next.
What Can We Learn from the History of Preventive Maintenance?
The oldest version of a PM program entailed a PM person walking around looking at, listening to, and feeling equipment while it ran, to determine whether the machine was working fine or not. Any discrepancy found during these walk-around inspections was either fixed on the fly or during a brief interruption of service, such as a shift change for example.
Some companies still subscribe to this style of maintenance. PM mechanics are assigned to constantly survey the machinery in order to detect issues that need corrective maintenance. Of course, the issue with this style of inspection is that the defect must be very late in its failure progression to be detected. This creates a scenario where production must be interrupted to fix the problem and the warehouse must keep a very large inventory of parts to deal with whatever may arise.
In the late 1960s, this style of maintenance was found to result in costly repairs and produce too much non-productive downtime due to not knowing what was going to break next and how long it would take to fix. This scenario gave way to a different PM execution model.
In the early 1970s, the concept of time-based replacement, or time-based preventive maintenance, came into popularity. There was a belief that all failures were a function of time or throughput and were therefore very predictable. With this predictability, organizations could organize their preventive maintenance strategy to replace parts or components at fixed intervals known well in advance and thereby avoid the problem of not knowing when the next failure would occur. They believed that accurate record-keeping, and simple statistics would solve their reliability problems.
Much to the chagrin of those who followed this philosophy, it did not work. Maintenance costs skyrocketed and system reliability went by and large unchanged. The problem was a lack of understanding of the cause of the problems. When random failures occurred, the traditional statistical opinion was that not enough data had been collected yet. The companies thought that with enough data, no failure would be random, all would be predictable. While this is the case, it was the type of data being collected that was the problem. Simply tracking hours to failure is a lagging indicator and will never point to the nature of the problem. The adoption of a system of 100% time-based replacement is not the answer. This realization paved the way for the breakthrough that would be made public in December of 1978.
The next style of PM that found some prevalence in the industrial manufacturing world was a hybrid of the previous styles. For years, maintenance people would plan a preventive maintenance task to go to a piece of equipment, disassemble it, and fix whatever the technician deemed needed fixing. This is probably the most common style seen today. The monthly preventive maintenance schedule or work order says things like “inspect the following components and repair as needed”. In essence, this is a blank check for the technician to apply whatever level of rigor the technician feels is required in a given situation.
Of course, this leads to a high degree of variation in the PM effort as different technicians apply their own idea of how bad is bad enough to work on at that moment. It also means that the degree of inspection is also dependent on how educated, task qualified, and thorough the technician happens to be. This style of PM is not much better than the PM mechanic walking around and working on whatever has the most smoke rolling off it.
The business results for this method reflect that level of efficacy as well. What is interesting is that maintenance managers grow increasingly frustrated with their PM process because of the lack of performance improvement even though piles of money are spent on the PM effort. This leads to action items such as doing more PM, doing it more often, concentrating on technician wrench time, and rewriting all the procedures to improve equipment reliability, none of which work because they are not the source of the problem.
Nowlan and Heap of United Airlines had developed Reliability-Centered Maintenance (RCM) as a failure mode-driven maintenance strategy. In the RCM system, all maintenance tasks are driven by a specific failure mode and have a specific strategy based on the impact of failure and type of failure mode. Failure modes may be random or may wear out with respect to time (see Figure 1).
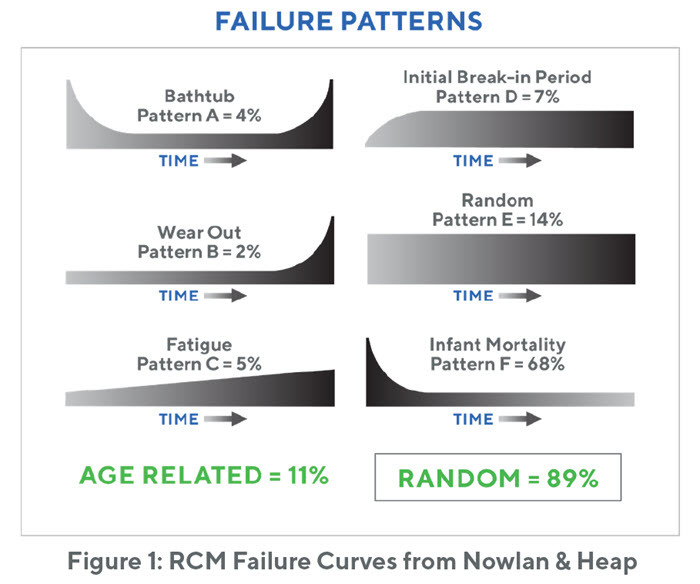
Random failure modes require inspections, and the corrective maintenance work is performed based on the condition of the defect at the time of the inspection. A common question is why infant failures are considered random. To answer that question, we must consider the definition of random. Random is literally defined as “having no specific pattern”. While it is true that infant mortality failures happen after work has been performed on a machine, such as after initial start-up or after maintenance activities, this does not happen after every initial start-up or after every maintenance activity. In fact, sometimes these infant failures happen after start-up or maintenance and sometimes they do not. Hence, there is no specific pattern, which is why they are considered random. Wear-out failure modes do not require inspections as frequently as the failure propagation is more predictable. This style of thinking about failure modes, defects, and strategies is perfect for preventive maintenance systems, and though this RCM report is over 30 years old, it remains the gold standard for reliability systems design for maintenance to this day.
Some organizations believe that the PM program should start with the precise original equipment manufacturer’s recommendations. They have the belief that no one knows the assets and equipment better than the people who made it. Unfortunately, this is not always the case. The one thing the manufacturer often does not know is the operating context.
This is not the case of course for purpose-built equipment, but it is certainly the case for general equipment that can be applied in many applications. Figure 2 shows the results of a reliability analysis based on knowledge of the operating context as compared to the OEM recommendations. Note that some of the task intervals had to be changed and some new tasks had to be initiated. This is a surprise to some people who believe that the manufacturer’s recommendations should be followed to the letter.
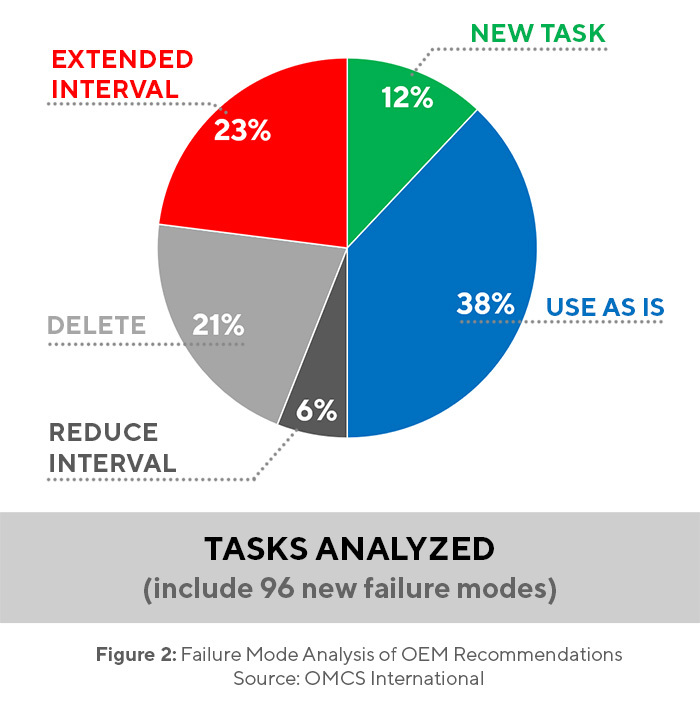
While this may be the case for purpose-built machines, it is not the case for general machinery. As such, the development of an equipment maintenance plan for a general-purpose machine in a specific application should consider the operating context and the operating environment.
The litmus test for whether a maintenance task remains in the equipment maintenance plan is based mostly on the RCM system.
- Does the task prevent a failure mode?
- Does the task detect the presence of a failure mode?
- Is the task regulatory or statutory in nature?
These tests help us determine if a task is value-adding and whether it should remain a part of the maintenance strategy. All too often, non-value-adding (NVA) tasks creep into the program over time and become bigger and bigger problems. The PM program becomes bloated and no matter how much bigger it becomes, it is no more effective, and soon becomes a burden to the organization instead of a program that solves problems. The typical scenario that creates such a large program is that upon experiencing a failure, the organization, believing they can PM their way to reliability, immediately assigns more tasks to the PM, at a higher frequency, and with more people. Of course, this does not address the problem for reasons we will discuss in just a moment, and the organization continues to falter while they spend even more on preventive maintenance. The fallacy is that most problems are random in nature and a time-based replacement strategy is not effective at all in dealing with random problems. To understand this phenomenon, we must first define a few terms.
A failure mode is the local effect of a failure mechanism according to the American Society for Testing and Materials (ASTM). An example might be simply “bent”, “broken”, or “leaking”. For the reliability engineer, this is not descriptive enough to identify the problem and solve it. So, a slightly different definition of failure mode will be used for this discussion. A failure mode then shall be described as the part, the problem, and the reason. Example: Bearing – Fatigued – Misalignment. This is read as: The bearing was fatigued due to misalignment. This description of the failure mode gives us all the information we need to effectively leverage a countermeasure against future failures. This definition will be used for the balance of this article.
Once we understand the failure modes, we can then assign one of the six failure curves found in Figure 1. The A-B-C curves denote an interval-based failure. These are the curves best suited for an interval-based reconditioning or replacement strategy. Curves D-E-F are random failures, and an interval-based strategy will not work for them at all. In fact, it will cost significantly more money and will result in no higher availability. Below is a table for a typical motor with a dominant failure mode that is random. The table shows the difference between a time-based strategy applied to a random failure and an inspection-based strategy for the same failure mode. The calculations were made within a Monte Carlo simulation software with typical costs of failure and repair for an electric motor in a typical manufacturing facility.
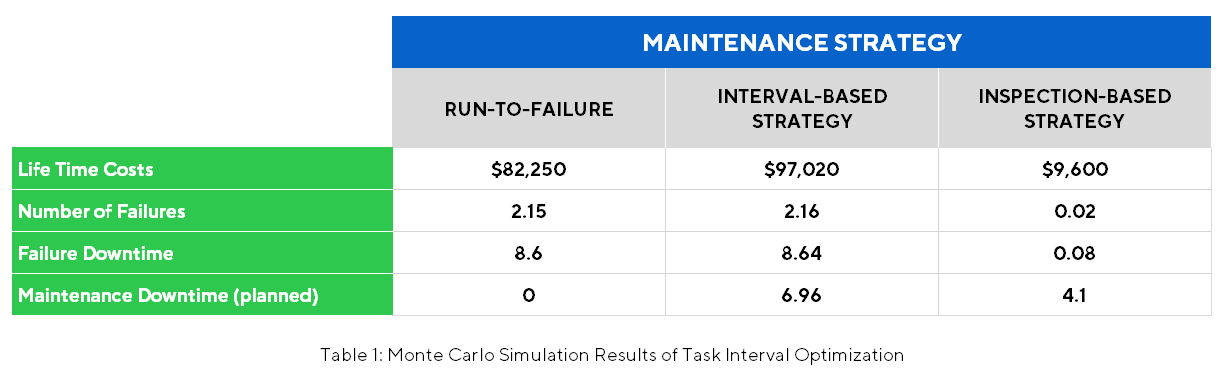
It should be obvious from the differences in the run-to-failure column and the interval-based strategy column that for a random failure, replacing the component on a fixed schedule does nothing to the availability of the component and only raises the maintenance costs. The answer to random failures is an inspection-based strategy where the component is inspected at some regular frequency and the repair is affected based on the condition of the component, regardless of time. This is a very doable strategy within a Predictive Maintenance (PdM) program. All the inspections should produce this type of work.
Free Preventive Maintenance Evaluation
See what a sample preventive maintenance evaluation looks like for your organization. Submit up to 100 preventive maintenance tasks and we will analyze and provide a report that shows where you can improve. If you include hours per task, then we can include the number of hours that can be freed up by optimizing your preventive maintenance tasks.
The P-F Curve
No one graphic within the realm of reliability speaks to all the concepts encompassed in the name reliability so much as the P-F Curve. This graphic says more with fewer words than any other graphic in the field.
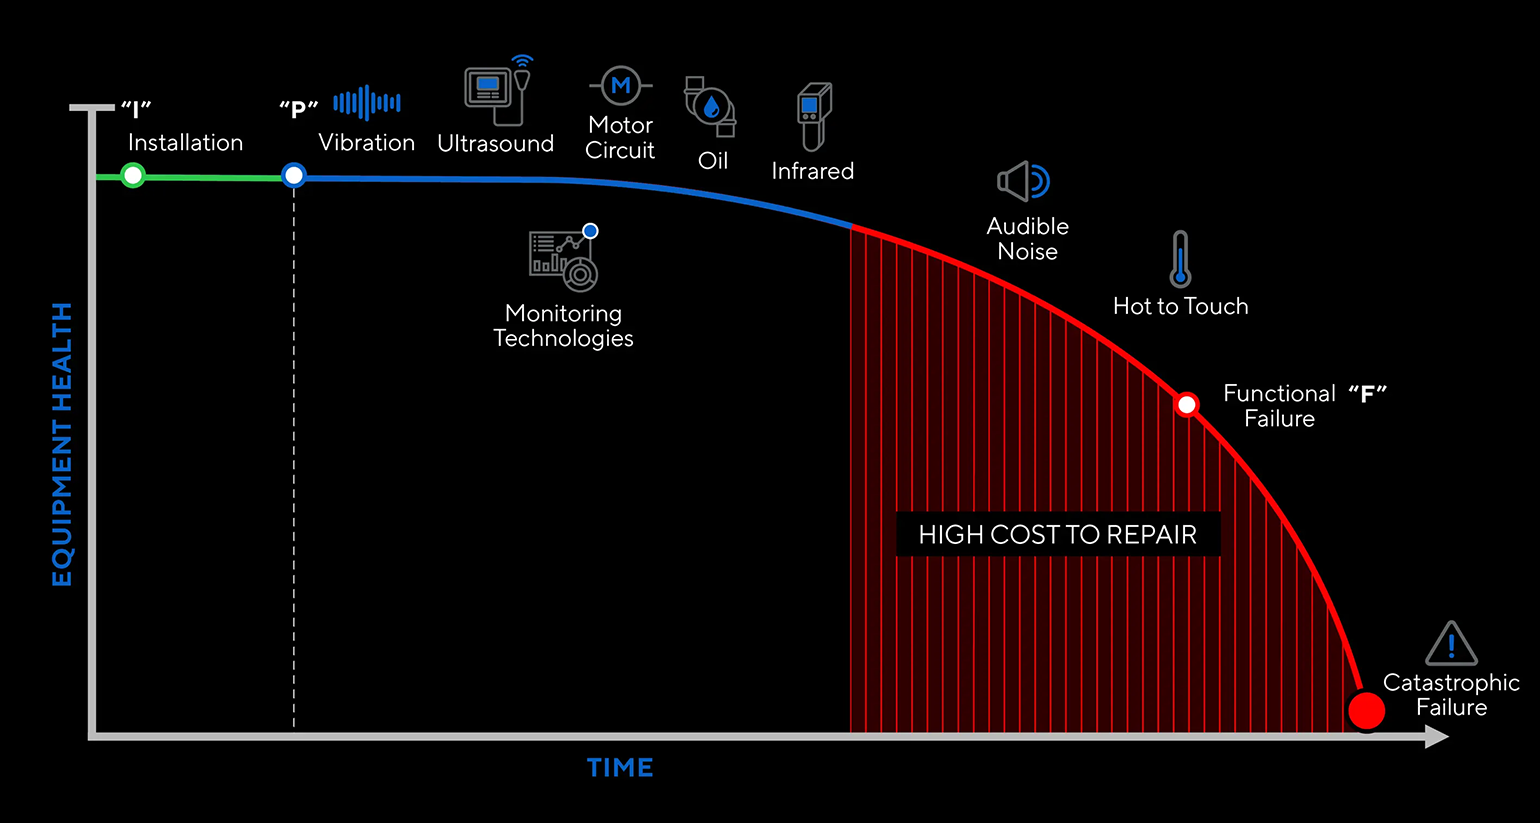
As defects propagate into a system, the signals these defects give off change as the defect passes through its severity progression cycle. The signals are different early in a defect’s life from what they are later in its life. These signals tell the inspector about the condition of the defect, which makes the planning and scheduling of the defect elimination much easier and more certain.
Acting on the defect as close to Point P (potential for failure) as possible creates several advantages for the organization. Among those advantages are lower repair costs, longer lead time for planning and scheduling, lower probability of failure, and a lower necessity for keeping spare parts in stock as opposed to ordering them as needed. These advantages embody all that is reliability, and it is for these reasons that the P-F Curve is the single most important concept in the field of reliability.
The P-F Curve has some implications for the preventive maintenance and Predictive Maintenance (PdM) programs. As for inspections, whether preventive maintenance or PdM, the closer to Point P that the inspection can identify the defect, the more advantageous that identification will have been. For example, using ultrasound to find an early bearing defect provides the organization with an average of 90 days to deal with the problem.
However, if an equipment owner relied solely on the eyes, ears, and touch of the operators and technicians to find the bearing defect (as is the case with traditional PM programs), then the plant would likely have something more like 5-7 days to effectively plan, schedule, and execute the work before the situation became more dire and the threat of failure was imminent, forcing maintenance to reschedule production and trigger a maintenance outage.
Types of Preventive Maintenance
There are six PM activity types. They are clean, inspect, adjust, replenish, replace, and rebuild. These six activity types may be completed by anyone in the organization, not just a maintenance technician. Operators and engineers may also play a role in PM.
Cleaning involves keeping the machinery clean enough for two things to occur. First, the machine must run efficiently, and reliably. It cannot do so if the machine is dirty. Second, the operator must be able to easily identify any defect or unacceptable condition with the machine. Therefore, operational personnel and not maintenance normally handle cleaning. The only caveat to this is where significant machinery disassembly is required, and then maintenance typically does the cleaning.
Inspection is the heart of any maintenance program. Inspections may fall into one of two major categories, quantitative and qualitative. Qualitative inspections do not require the use of measurement tools, such as feeler gauges, micrometers, or dial indicators. Permanently mounted instruments like gauges are technically measurement tools, but they do not require a special skill set to read, so for this discussion, reading a gauge is considered qualitative, not quantitative.
Quantitative inspections are those inspections requiring a measurement tool and/or a special skill set. As a rule of thumb, qualitative inspections should be assigned to machinery operators and quantitative inspections to maintenance technicians.
Some components and parts need adjustments over time. Operators can perform some of these adjustments if the proper set points have been marked by a skilled craftsman. The most common example of this is center lining. Some machines have different settings depending on the mode of operation or the product they are running, which require the machine to be configured differently. These different settings are marked to indicate the proper positions for different pieces of the machine. Operators often make these machinery moves themselves without the assistance of a maintenance technician.
Other adjustments may include things like calibration, where the technician measures something, compares the measurement results to a known standard, and then adjusts the item to bring it back into calibration. Additionally, some adjustments are made based on wear. For example, if material hits a wear plate, the plate thins over time. To maintain a given clearance, the position of the plate must be moved. This is a classic example of an adjustment activity as a PM task.
Replenish simply means to put back what has been consumed. Lubrication is the most common replenishment task, but not all replenish tasks are related to lubrication. Another example might be coolants that are consumed in the process. Not all lubrication tasks require someone highly trained and skilled in contamination control techniques. Some lubrication tasks require only basic skills that operators can perform. If the lube process has been well defined such that the proper amount and type of lubricant is delivered at the proper frequency, there is no reason why anyone cannot perform the task.
Replace can be as simple as replacing a filter based on the number of hours it has been in service, like air filters or water filters. Replace can also be as complex as replacing catalyst elements based on the number of hours in service. But what they both have in common is that the replacement was based on a fixed interval; it was not based on waiting for the system to malfunction in some way only to find out that a replacement had not been made. At this point, the replacement is an emergency and not preventive maintenance.
Rebuild is essentially like replace. If the failure mode is known and the failure mode is a clear wear out mechanism, and the interval is known, then rebuild may very well be the correct PM strategy. The important factor here is that the rebuild takes place on a regular and fixed interval. Rebuilds that are performed on an as-needed basis are not considered PM, they are simply repairs or corrective work. It only counts as PM if the activity is performed on the interval. Additionally, major repairs found and corrected during a PM do not count as PM. Some organizations do this to avoid the increase in any emergency maintenance metrics and also to avoid the Mean Time Between Failure (MTBF) of the machine/system from being negatively affected.
Some of these same PM activity types can be performed in the storeroom just like they are performed out in the manufacturing or production environment. Motor and pump shafts should be turned on a regular basis. Bearings and seals should remain in their original packaging. V-belts should be stored flat and not hung on hooks. Parts made from raw metals should be protected from oxidation. Items that are sensitive to dust and moisture should be sealed and protected. Bearings should be stored on anti-vibration mats to protect them from false brinelling. These tasks are typically assigned within the preventive maintenance software such as the Computerized Maintenance Management System (CMMS) and executed at a set frequency, just like the tasks performed on the installed equipment. Stores PM activities are not much different. There should be inspections, cleaning, and adjustments.
PM Scheduling and Compliance
There is a difference between adherence and compliance, at least in the PM world. PM Compliance is the percentage of PM tasks that were completed as per the scheduled maintenance list.
For example, if the CMMS showed 212 PM tasks scheduled for August and only 203 of them were completed, the PM Compliance for August would be 95.7%, which is good because the goal should be >95% for PM Compliance. While there is no benchmark data to back up the claim of 95% as a target, it is a generally accepted target. Each organization should establish its own target.
When evaluating the PM Compliance metric, manpower should be considered as well. If the 212 PM tasks scheduled for August represented 488 labor-hours, the 95.7% compliance should have consumed something close to that same percentage of labor-hours. This is not always exact, as some PM tasks take longer than others, but it should be within the realm of believability.
However, if the 95.7% PM Compliance only consumed 54% of the labor-hours that were scheduled, there is a problem. If this happens, the PM completion process should be evaluated, as there is likely someone completing PM on paper and not actually doing the work or the PM completion labor is being charged to something other than the PM. Either way, there is a problem.
PM Route Adherence is another measure altogether. Route adherence is the measure of how closely the PM task was completed within its call window. The call window is the allotted time for the timely completion of the task and ideally should only allow for early completion - 10%.
For example, the monthly PM was due on 14-October. As it is a monthly PM, the window is 3 days. So, the PM could be completed as early as 11-October, but no later than its due date of 14-October to receive full adherence credit. If the PM is completed outside of the window, it is still checked as being completed, but the degree of how early it was completed determines the degree of route adherence. If it was completed outside of that window, the interval between it and the previous completion (if early) or the next completion (if late) is being infringed upon.
Therefore, when measuring the PM program, we want to evaluate PM compliance both from a percentage of task completion, the percentage of labor-hours consumed, as well as the degree of route adherence. Leaving one of these metrics out of the equation opens the organization to some degree of risk with respect to the efficacy of the PM program.
PM schedules should be load-leveled across the balance of the scheduled time. For example, I do not want to have 70% of my PM labor-hours in the first week of the month with the other three weeks having 10% each. The reason I do not want this is that machinery failures and other emergency work may disrupt which machines I have available for PM work, and it thus impacts the rest of the month. Not to mention, it puts all the missed PM at risk to miss the – 10% adherence rule. Evenly distributing the PM load across the month, the quarter, or the year makes the management of the PM effort much easier.
Mean Time to Implement (MTTI) is another useful metric for PM program management. The average time it takes to complete the corrective work generated from the PM inspections is the MTTI. The idea of this metric is to drive the timely completion of the corrective work identified during the PM inspections. Like all inspection data, there is a best-if-used-by date on all information. Inspections that yield defects must be corrected in a timely manner lest the defects turn into equipment failures. Failing to act quickly enough begs the question of why inspect it at all if you are not going to act on the information. All corrective work from PM inspections should be completed with a less than 30-day MTTI.
ABOUT ALLIED RELIABILITY
Allied Reliability provides asset management consulting and predictive maintenance solutions across the lifecycle of your production assets to deliver required throughput at lowest operating cost while managing asset risk. We do this by partnering with our clients, applying our proven asset management methodology, and leveraging decades of practitioner experience across more verticals than any other provider. Our asset management solutions include Consulting & Training, Condition-based Maintenance, Industrial Staffing, Electrical Services, and Machine Reliability.
Subscribe to our Blog
Receive the latest insights on reliability, maintenance, and asset management best practices.