Companies that implement predictive maintenance (PdM) programs reduce maintenance costs effectively and decrease up to 30% of their preventive maintenance (PM) tasks.
50%
Decrease Maintenance Costs
55%
Reduce Unplanned Downtime
60%
Decrease Repair and Overhaul Time
30%
Reduce Spare Parts Inventory
30%
Increase Mean Time Between Failures (MTBF)
30%
Increase Uptime
Why Predictive Maintenance Solutions?
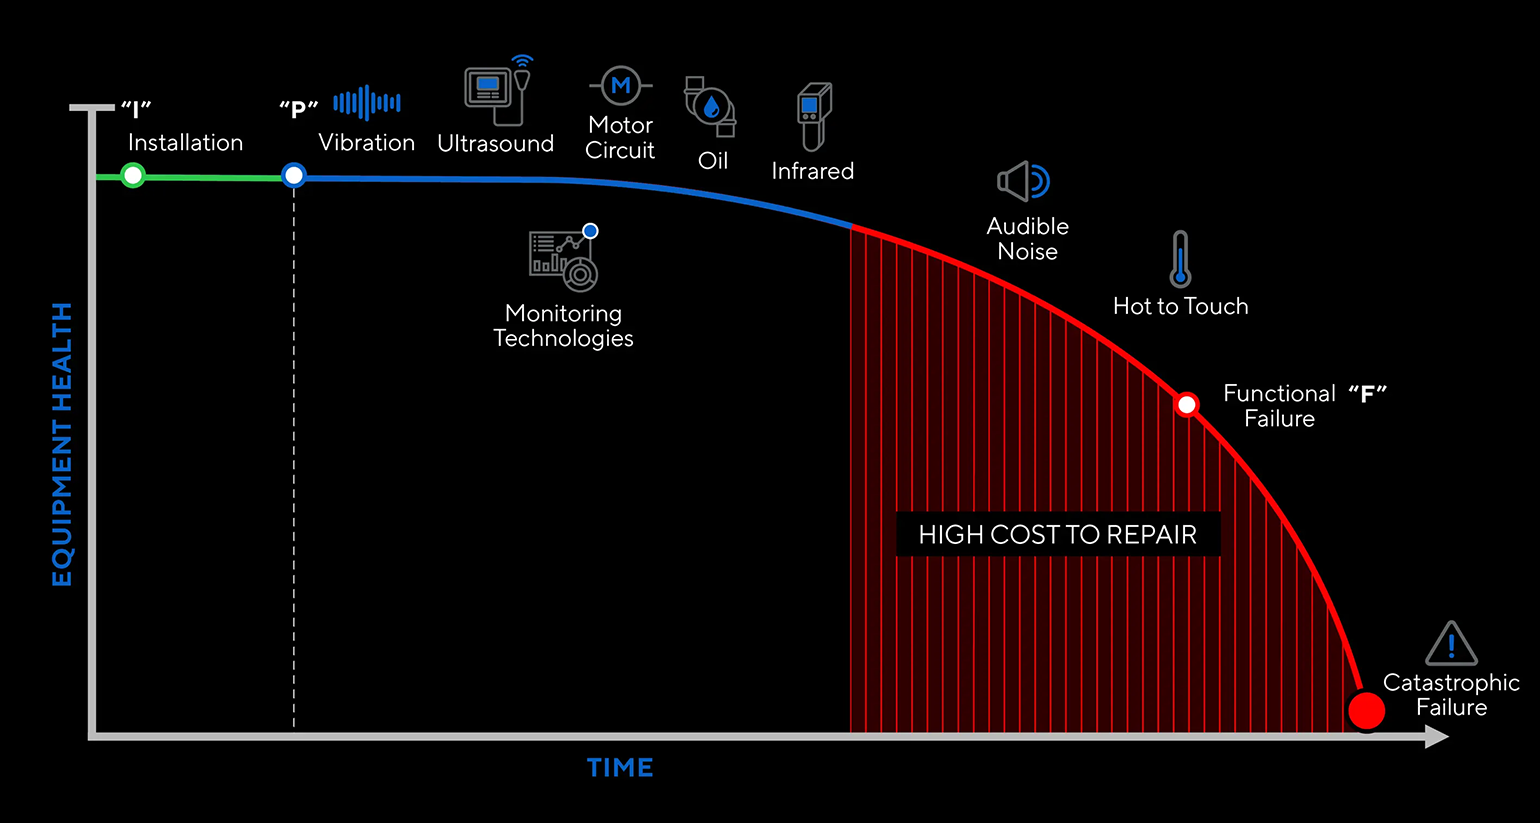
Most industrial equipment does not suddenly break down and stop working. The truth is equipment breaks down gradually, over a period of weeks or months. Furthermore, it gives off numerous warning signals along the way.
These early warning signs, such as slight changes in temperature, vibration, or sound, can be detected by condition monitoring equipment in real-time, including vibration analysis and oil analysis. This allows your maintenance team time to plan, schedule, and make repairs before you encounter equipment failures and unplanned downtime. With artificial intelligence (AI) and machine learning (ML) technology, data can be gathered and analyzed with greater efficiency.
The First Step to Establishing a Predictive Maintenance Program
The first step to ensuring a successful PdM program is a simple list – a detailed and accurate equipment list.
Why? Your equipment list is the foundation for all the key steps that follow. If your list is incomplete or incorrect, everything that is built from it will be flawed. Any shortcuts or inaccuracies will be exposed as big problems later. Time is money, gain more of it by eliminating unnecessary preventive maintenance, decreasing reactive maintenance, and optimizing asset maintenance. A good list is essential for achieving everything listed below:
Identifying how your equipment can fail
Choosing the right PdM technologies to apply to the asset
Determining the ideal amount of PdM coverage for your plant
Ranking the criticality of each piece of equipment
Building maintenance management databases for each PdM technology
Determining PdM staffing levels
Implementing a sound work order system
Download our eBook, PdM Secrets Revealed, for a step-by-step guide to implementing a PdM program.
How to Choose the Right Predictive Maintenance Technologies
Many companies begin a PdM program by choosing one of the most common technologies, like Vibration, Infrared, or Ultrasound. After they get some basic training and experiment for a while, they start applying the technology to their most critical equipment.
Makes sense, right?
Wrong. Let’s go back to the basic concept of PdM.
Almost all equipment gives off early warning signals – such as changes in temperature, vibration, or sound – before it fails. These warning signals, or failure modes, can be detected with certain Predictive Maintenance (PM) technologies.
The problem is that one or two technologies alone cannot detect the majority of the warning signals in your plant. As a result, a single-technology PdM program will miss far more faults than it catches.
The key to a successful PdM program is to ensure it is highly sensitive to the failure modes of your equipment. That is why you need to apply multiple technologies to detect most failure modes in your plant.
Ultimately, your equipment’s failure modes and criticality determine which technologies you apply, not the other way around.
The concept is simple, but you would be surprised how many companies get this backward.
A multi-technology approach lets you double-check and confirm “fault findings” between technologies. In addition, it allows you to catch problems with one technology that another might miss.
Ultimately, the biggest reason to apply multiple technologies is this: there is little if any, payback from using just one or two PdM technologies. You will miss most of the early warning signals that occur, so the equipment will fail anyway.
The payback comes from integrating a full range of technologies across a high percentage of your asset base. That is why the fundamental starting point for a PdM program is:
Understanding all the failure modes in your plant and
Applying the technologies that will detect them.
If you do not have the time or expertise to determine the failure modes for all your equipment and map them to the appropriate PdM technologies, Allied Reliability has an Asset Health tool that will use a database with several hundred equipment types already mapped to the appropriate technologies. With this, you can take the equipment on your equipment list and identify the possible failure modes for each, then confirm which PdM technologies and inspections to apply.
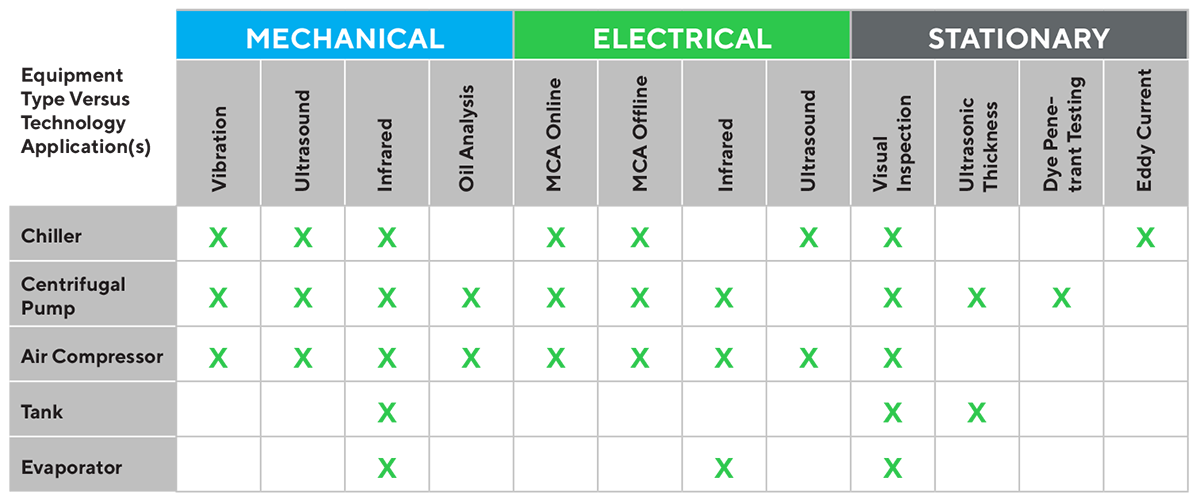
Below is a sample of recommended technologies by equipment type for a specified environment:
This tells you which PdM technologies are required to cover your equipment. Best of all, the whole process takes hours to complete rather than weeks or months.
Which Equipment to Monitor with Predictive Maintenance Technologies
If you have a detailed criticality ranking of your asset list, you can determine your maintenance strategy, prioritize work, and make better risk management decisions. Criticality rankings should be a single score based on collective agreement from:
Production
Maintenance
Purchasing and Logistics
Health, Safety, and Environmental (HSE)
Accounting
Sales and Marketing
Customer Service
The problem is that many companies use the ABC approach, with all equipment being given an A, B, or C priority. With this method, most equipment falls somewhere in the middle and gets a “B” rating. When it comes to priorities, which one will you work on first? You cannot address all of them at once, so what is your priority?
This is why you need a single score and overall ranking for each asset. With this information, you can focus your PdM resources on equipment with the biggest impact on plant performance.
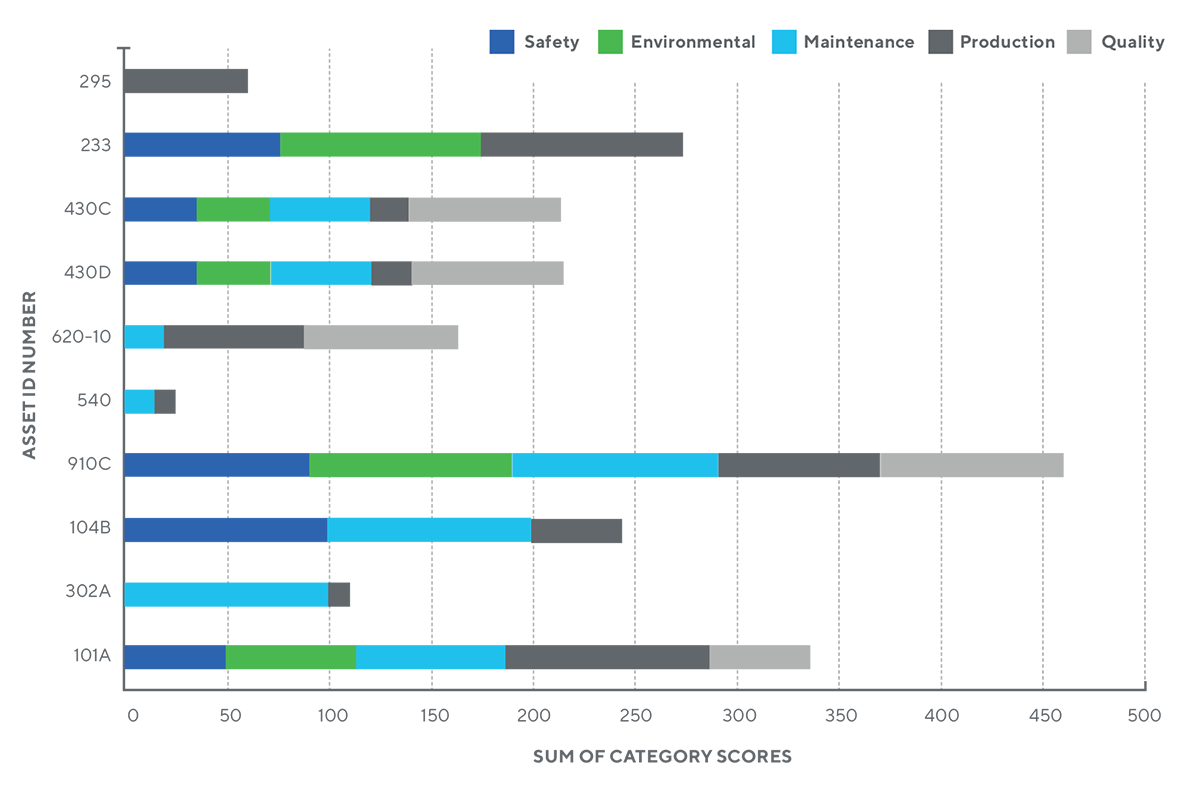
A sample criticality ranking for a single piece of equipment is shown on the following page. Notice how each asset has a single composite score based on five key criticality factors:
Safety
Environmental
Maintenance
Production
Quality
Sample Criticality Ranking
Choosing the Right Level of Predictive Maintenance Coverage
For most industries, benchmark data is available describing how much PdM coverage is considered Best Practice for that industry.
For example:
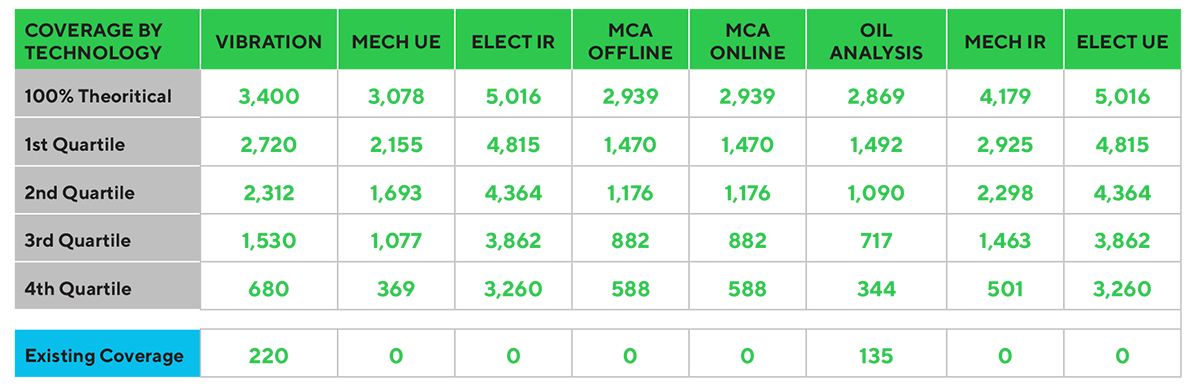
As you can see, the data compares existing coverage for each technology to 1st, 2nd, 3rd, and 4th quartile performers. This is extremely useful information to determine how your current coverage ranks versus best practices in your industry.
The likelihood that you could cover 100% of equipment with applicable technologies is not high; however, a 1st Quartile performer could cover 2,720 pieces out of 3,400 with Vibration and still have a tremendously successful PdM program.
In our example, the plant covered only 220 pieces of the available 3,400 that would have benefitted from Vibration Analysis. This company is not even at the lowest performing 4th Quartile coverage of 680. The remainder of the row shows many zeros, showing that several of the PdM Technologies are not being used at all. In fact, this facility uses only Vibration and Oil Analysis and on far fewer pieces of equipment than they could be. This facility has some opportunity to drive more returns from its current “level” of activity, but it must be done with a systematic approach.
When designing or enhancing a PdM program, the 100% Theoretical Model gives the facility a glimpse at what the maturation stages look like. Factors such as workflow maturity, criticality, craft skills, and knowledge/acceptance need to be considered when deciding to implement the appropriate PdM program for your business. Ideally, a site should select the technologies that will generate the quickest Return on Investment (ROI) while demonstrating vital momentum to build upon. Technologies should complement your business processes, not overwhelm them.
What to Measure – 11 Key Predictive Maintenance Metrics
There are many ways to measure the results and impact of a PdM program. It is important to consider carefully which metrics to use. The following are some guidelines and suggestions.
With that said, the number one PdM metric to consider is this:
WHAT PERCENT OF TOTAL MAINTENANCE LABOR-HOURS IS DRIVEN BY PDM?
This is the single most important metric to track. On average, best practice reliability programs generate approximately 50% of their work from PdM inspections and corrective work. If PdM and the results of PdM are not generating at least half of your work total, you have room for improvement.
PdM is proven to be more cost-effective than preventive or emergency maintenance; shouldn’t it account for at least half of your work?
Surprisingly enough, most companies do not know how much PdM work they do. That is because they mix PM and PdM together, so they cannot break out a true PdM value. We have found that most plants in North America generate less than 10% of their maintenance workflow from PdM.
What Else to Track:
Depending on the maturity of your program, here is a list of the other 10 metrics that should be used to track the success of your efforts:
PdM effectiveness – hours of corrective work identified by PdM divided by hours spent on PdM inspections
Percent of PdM recommendations completed within 30 and 90 days
Percent of workflow that is planned maintenance (target is 80%+)
Total planned work in the planner’s backlog
Adherence to the PdM schedule
Wrench time
Meant Time Between Failure (MTBF)
Maintenance costs as a percent of asset base
Maintenance costs as a percent of sales
Overall Equipment Effectiveness (OEE) and asset utilization