
OEE vs. MTBF
OEE (Overall Equipment Effectiveness) and MTBF (Mean Time Between Failure), which is right for your business? Both metrics can be very informative and drive specific behaviors when applied correctly. When applied incorrectly, they can lead to confusion and frustration. In this post, I hope to shed some light on which of these measures may be more meaningful for your organization.
Overall Equipment Effectiveness (OEE)
OEE measures the percentage of manufacturing time that is truly productive.
Perfection at OEE is 100%. Perfection means that you are running as fast as possible during planned (allocated) production time with no defects. Anything more than that, and you are breaking a few of the basic laws of physics, but we will save that discussion for another time.
The common OEE formula is as follows:

- OEE = Overall Equipment Effectiveness
- A = Availability = The ratio of the run time to planned production time.
- R = Production Rate = The actual production speed compared to the ideal cycle time.
- Q = Quality Rate = For all the units that you produced, what percentage of them were acceptable for sale to the customer, meeting the stated quality requirements.
For example:
- Availability = 80%
- Production Rate = 90%
- Quality Rate = 99%
- OEE = 80% X 90% X 99%
- OEE = 71.28%
A Note About Availability:
Availability seems straightforward but can be a little tricky when you dig deeper into it. Typically, we would use the anticipated or allocated production time as the basis by which to compare your actual performance in the OEE calculation. For example, if you are running two 8-hour shifts per day, 5 days per week, then the denominator in the availability equation would be 2X8X5 = 90 hours. If we ran, at any speed, for 45 of those allocated 90 hours, then our availability would be 50%.
If we find ourselves in a sold-out position, we may elect to run 24 hours per day, 7 days per week, and thus our denominator would be 24X7 = 168 Hours.
There are many variations on OEE, but considering the anticipated or allocated production time allows those monitoring this metric to focus on those factors that are truly within their control (unplanned downtime, machine adjustments, planned downtime, changeover time., etc.) rather than paying too much attention to non-scheduled time which may be one of the larger detractors from OEE, and totally out of their control
OEE is a fantastic measure for a few important reasons:
- Nowhere in the definition do the words “maintenance” or “operations” appear. It brings us together under one common measure. It facilitates two teams who can easily work at cross-purposes together. For example, availability losses can be experienced because of both maintenance and operating practices.
- It forces us to focus on the loss of potential rather than what we have accomplished with no idea of what might be possible.
- It brings together three aspects that are critical to meeting our customers' needs. For example, if we only measured availability, we might overlook the fact that we ran at reduced speed.
- It provides insights into how to improve your manufacturing process.
OEE is a bit of a universal metric; measuring it is a manufacturing best practice. It includes many of the critical aspects of your performance into a single metric. If you include some safety and cost measures, you are approaching a well-formed maintenance scorecard.
Mean Time Between Failures (MTBF)
MTBF tells us the average time we should expect to see an asset fulfill its designed function before experiencing a failure. Higher MTBF performance is better, as it indicates that your asset performs its intended function longer without any interruption attributed to failures.
Those who experience low MTBF should expect to see higher levels of unplanned downtime, higher repair costs, and possibly an associated increase in labor costs. All attributed to the repairs that are required on a more frequent basis.
Downtime that may exist associated with scheduled maintenance activities is excluded from this calculation. MTBF can be used in conjunction with mean time to repair (MTTR) to calculate system availability (i.e., the probability that a system is not down or undergoing repair when it needs to be used).
Calculating MTBF is relatively simple:
MTBF = (# of Assets X Time Frame) / # of Failures in that time frame
- Number of Assets = Total Count of Assets, generally grouped by some approximation of asset type (pumps, rotating equipment, motors, etc.) in a specific area of focus (plant-wide, department, operating area, etc.).
- Time Frame = Frequency of measurement – usually monthly or annually.
- Number of Failures = The number of occurrences where the asset failed to fulfill its function.
Note: MTBF is the reciprocal of the Failure Rate (1/MTBF = Failure Rate).
For example:
Assume we measure MTBF monthly, and we have experienced 4 pump failures in our department during this time frame, with a total asset population of 80 pumps in our department then MTBF is calculated as:
- MTBF = 80 Pumps X 1 Month / 4 Failures
- MTBF = 20 Months
This means, on average, we should expect to experience a failure on one of the pumps in our department every 20 months. That’s not great performance; high-performing organizations generally enjoy MTBF of 120 months (10 years) or higher (full disclosure, MTBF is often measured both on a monthly and annual basis). Of course, this all depends on many factors, your operating conditions and the current state of your maintenance program being two significant contributors.
MTBF is a relative measure. Measuring MTBF on a highly critical asset or group of assets can be very meaningful. Measuring MTBF across an entire department or facility provides a little less value but is still informative with regard to our ability to maintain our assets. Increasing MTBF means we are doing something right.
It is also important to note that MTBF does not consider situations where assets are running at a reduced rate, nor does it consider the size and duration of the event (not all equipment failures are equal – some are longer and have a greater impact than others).
Why Calculate MTBF?
There are several reasons why we calculate MTBF:
- Reliability Assessment: MTBF provides a quantitative measure of reliability. It helps engineers and designers assess the likelihood of failure within a given timeframe, which is crucial for ensuring that systems meet performance requirements and user expectations.
- Predictive Maintenance: By knowing the average time between failures, maintenance schedules can be optimized. Predictive maintenance strategies can be implemented to preemptively address potential issues before they lead to system downtime, and preventive maintenance strategies can be improved to tackle issues before they cause failure.
- Product Improvement: MTBF data can be used to identify weak points in a system or component design. Manufacturers can use this information to make improvements, enhance quality, and ultimately increase product reliability.
- Service Level Agreements (SLAs): In service-oriented industries, MTBF calculations are often used to define and meet service level agreements. It helps service providers set realistic expectations for total uptime and reliability, which are essential for maintaining customer satisfaction.
- Cost Analysis: Understanding the MTBF of components or systems allows for better cost-benefit analysis. It helps organizations allocate resources effectively by balancing the costs associated with maintenance, repair, and replacement against the potential losses incurred due to system failures.
- Regulatory Compliance: In certain industries, regulatory bodies may require companies to maintain a certain level of reliability and document MTBF values as part of compliance measures. This ensures that products and services meet established standards for safety and performance.
Overall, MTBF is a valuable metric that helps organizations ensure that their maintenance strategy is delivering reliability, availability, and performance of their systems and products, ultimately leading to improved customer satisfaction and operational efficiency.
How to Improve MTBF
Improving Mean Time Between Failures (MTBF) involves various strategies aimed at enhancing the reliability and performance of systems or components. Here are some ways to improve MTBF:
- Component Selection: Choose high-quality components that are known for their reliability and durability. Conduct thorough research and consider factors such as vendor reputation, past performance, and reliability data when selecting components for your system.
- Redundancy: Implement redundancy in critical components or systems to ensure continuous operation even in the event of a failure. Redundant components can automatically take over if one fails, thereby increasing overall system reliability and extending MTBF.
- Preventive Maintenance: Establish a proactive maintenance program to identify and address potential issues before they lead to failures. Regular inspections, lubrication, calibration, and cleaning can help prevent premature failures and extend the operational life of equipment.
- Monitoring and Diagnostics: Implement monitoring and diagnostic systems to continuously assess the health and performance of equipment. Real-time monitoring can detect abnormalities or early signs of failure, allowing for timely intervention and maintenance to prevent downtime.
- Design Improvements: Analyze past failures and incorporate design improvements to address common failure modes or weak points in the system. Use failure analysis techniques such as Failure Modes and Effects Analysis (FMEA) to identify potential failure modes and develop mitigation strategies.
- Training and Personnel Development: Provide training to personnel responsible for operating and maintaining equipment. Well-trained operators and maintenance technicians can identify and respond to issues more effectively, reducing the likelihood of failures and improving overall reliability.
- Environmental Control: Maintain appropriate environmental conditions such as temperature, humidity, and cleanliness to prevent premature degradation of components. Extreme environmental conditions can accelerate wear and lead to increased failure rates.
- Supplier Quality Control: Work closely with suppliers to ensure the quality and reliability of components and materials. Establish stringent quality control measures and perform regular audits to verify compliance with specifications and standards.
- Continuous Improvement: Foster a culture of continuous improvement within the organization. Encourage employees to identify opportunities for improvement, implement corrective actions, and monitor the effectiveness of implemented changes to drive ongoing reliability improvements.
By implementing these strategies, organizations can enhance the reliability and performance of their systems or components, leading to increased MTBF and improved operational efficiency.
Which is right for you? OEE or MTBF?
My short answer to this question is that if you can measure OEE in a meaningful way, then this is the metric for you. It covers many of the bases. Sadly, OEE does not fit in all situations.
Discrete Manufacturing
Discrete manufacturing is the production of distinct items. Automobiles, furniture, toys, smartphones, and airplanes are examples of discrete manufacturing products. You can easily identify a single item produced by discrete manufacturing.
If this definition fits, then OEE is for you. You should be concerned about factors such as availability, performance efficiency, and quality rate. These factors are central to your success.
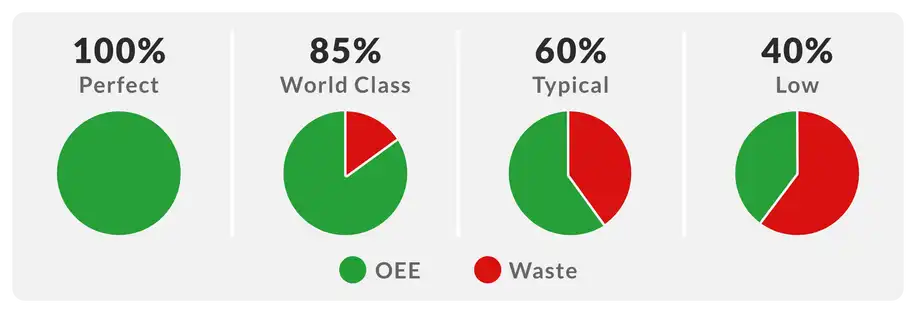
Curious what world-class OEE looks like? Leanproduction.com defines world-class OEE at 85% (see their image below).
Process Industries
Process industries are those that run a continuous batch where the distinction between one unit and another is not easily identified. Power generation, oil production, transport, and refining, as well as many petrochemical processes, fall into this category.
Unfortunately, in these types of environments, OEE might not serve our purposes for the following reasons:
- Availability is often so critical in process industries that we see a high level of redundant equipment (with a corresponding capital investment). If we experience a failure of one piece of equipment, we switch over to the redundant unit and continue. For this reason, big losses in availability are usually greatly minimized.
- Performance efficiency losses can exist, but rather than run slow, we often immediately bring the backup unit online and begin a fix to the underperforming unit.
- It is often difficult, if not impossible, to identify quality losses in process industries. What does a bad kilowatt look like?
In these situations, establishing MTBF as a meaningful measure on specific highly critical assets and trending your performance upward will likely provide much more value than OEE.
Conclusion
Metrics are a funny thing. When used correctly and with the right application, they can provide a lot of value and focus to an organization. Used incorrectly, they tend to cause more harm than good.
When selecting the best metrics for your team, consider the following advice:
- Keep it simple. Too many measures cloud the focus.
- Make sure we know what actions to take to improve the performance of each metric. What must we do differently to improve? It sounds obvious, but surprisingly it is often overlooked.
- Talk about it often. A metric is only as good as the leader who draws the team together to own it and acts on it.
ABOUT ALLIED RELIABILITY
Allied Reliability provides asset management consulting and predictive maintenance solutions across the lifecycle of your production assets to deliver required throughput at lowest operating cost while managing asset risk. We do this by partnering with our clients, applying our proven asset management methodology, and leveraging decades of practitioner experience across more verticals than any other provider. Our asset management solutions include Consulting & Training, Condition-based Maintenance, Industrial Staffing, Electrical Services, and Machine Reliability.
Subscribe to our Blog
Receive the latest insights on reliability, maintenance, and asset management best practices.