
Understanding the Complexities of Ultrasound for Machine Condition Monitoring
Most people try to use ultrasound without understanding the intricacies of device settings or details of application and method. We commonly run across clients who are misusing or misapplying ultrasound without even knowing it. As a result, they have no faith in its effectiveness when it could be one of the more powerful techniques they employ.
Basic Applications
Airborne and structure-borne ultrasound technologies got their initial fame and glory from being the very best tool to identify pressure leaks and vacuum leaks, most notably on compressed air systems. For example, repairing the leaks discovered during an air leak survey could typically pay for the ultrasonic device and the cost of performing the inspection. This short return on investment made ultrasound one of the most popular condition monitoring tools in the business. This inspection method is easier to understand, cheaper to acquire, and simple to implement, making it an excellent tool for any condition monitoring program, regardless of the program’s maturity.
As the technology became more widely understood, widespread applications soon followed. In no particular order, mechanical, electrical, and stationary applications started to find their way into ultrasound programs around the world. On the electrical side, the airborne scanning of electrical apparatus for the presence of arcing, tracking, and corona has simultaneously made the maintenance of these electrical apparatus easier and more effective. Airborne ultrasound has also made operating and maintaining these same apparatuses safer through the reduction of situations where there is a high arc flash potential.
On the mechanical side, the application of ultrasound has made the identification of high-frequency faults easier. Problems such as bearing and gear defects, cavitation, and lubrication issues, as well as electrical problems in motors, are now more easily identified. As stationary faults go, the detection of valve and steam trap issues is also possible through the application of ultrasound.
Safety and Quality Note
One of the things we note many people do incorrectly in the field is the degree of pressure they place on the tip of the contact sensor when applying this technology in a mechanical or stationary inspection. What we know from application is that if one were to press harder or softer, the dB levels change. Thus, it is important for the analyst to maintain constant pressure during the inspection. Of course, this is easier said than done for the analyst needs to see the back of the unit during data collection. This makes it difficult to get the right angle to accomplish both.
Further, applying pressure of the contact sensor on a curved surface can be dangerous to the analyst and the instrument. It is easy for the tip to slide off the curved surface and find its way through a guard and onto something rotating or something hot. This could easily damage the probe and potentially injure the analyst. The solution is to simply use the magnet ultrasonic sensor instead of the contact probe. This sensor ensures constant pressure and safe access to the data allowing the analyst to rotate the instrument necessary to see the back of the instrument and navigate the screens.
Advanced Applications
As far as advanced applications with ultrasound, the most useful description of a method is to simply treat it more like vibration analysis. The equipment manufacturers provide both the hardware and the software to perform route-based data collection and analysis. Routes can be built into the software, uploaded to an ultrasound device, and then a technician can collect sound files and waveforms from each machine. This data is then uploaded back to the database for analysis and trending purposes.
Frequency, Sensitivity, and Distance
One of the most common mistakes we see made is the misuse of the frequency and sensitivity settings of the instrument. We commonly see people disregarding the frequency setting as they move from the airborne sensor to the contact probe, or as they move between different mechanical components. For applications, when the contact probe is being used, the frequency level should be set to 30 kHz for bearings and gears and 25kHz for valves and steam traps.
This is a starting point for measurements, and the frequency should then vary either up or down to provide the clearest sound of the component we are currently inspecting. This frequency should be recorded and then used consistently whenever we are collecting data or just listening to this component. For airborne applications, the filter should be set to 40 kilohertz, where it should remain for the duration of the airborne survey.
There is a considerable misunderstanding of the sensitivity setting on the ultrasound device. This is due to the change in amplitude of the sounds in the headset, so sensitivity is often confused with volume. The sensitivity setting controls the input gain of the device, which is why the volume increases in the headset. However, the input gain is not volume but controls the max amplitude of the signal that the device is expecting.
If the sensitivity is too low, we may miss certain sounds, but if the sensitivity is too high, the sensor will oversaturate, and the signal will be lost. This is called clipping; if you have a device that continuously displays amplitude (Decibel or dBs) and you turn up the sensitivity on a strong signal, you will see the dB level start to drop. This is not a reduction of amplitude but rather signal that is being clipped out of the data. The sensitivity level will be adjusted and set differently for each component and may even need to be adjusted during a future measurement if the condition of the machine has worsened. During route-based collection, the sensitivity level should be recorded and used as a starting point for future measurements.
The third often misunderstood factor is not a setting on our device at all but is key to achieving accurate amplitude readings when performing airborne ultrasound. This is the distance to target. When quantifying pressure leaks, we must record the distance between the sensor and the location of the leak.
As we move closer to the source, the amplitude will go up, and as we move further away, the amplitude will decrease. This is called the Inverse Distance Law, and since we use amplitude to quantify and justify a pressure leak survey and calculate the waste in dollars, recording these distances and using the same distance from leak to leak is critically important. Without the proper distance, a technician could artificially make a leak seem much worse than it really is, or potentially dampen a severe leak.
Sub-surface Fatigue versus Spalling
Bearing fatigue begins with sub-surface fatigue and then propagates to spalling. In ultrasound, spalling is easy to detect. The pattern of the sound is easy to detect as we are hearing each rolling element run across the spall, and since the spacing of the elements is consistent around the bearing, the sound produced is consistent and repetitive.
Spalling is also detectable through vibration analysis; however, ultrasound can also detect sub-surface fatigue in its early stages before it emits a vibration signature. Sub-surface fatigue sounds smooth but is loud. In fact, it sounds much like a deficiency of lubrication. The difference is that adding grease to a bearing with sub-surface fatigue cannot get the dB levels back down all the way to baseline levels. Sub-surface fatigue is as smooth as the baseline but louder than the baseline. It is like a lubrication deficiency that cannot be removed with a few pumps of grease. This bearing defect can be difficult to find as it presents exactly like inadequate lubrication.
Slow Speed Bearing Analysis
Ultrasound is an excellent tool for slow-speed bearing analysis. However, there are some common misconceptions about why this is so and how it is done. Just because you are using ultrasound over a conventional vibration analysis setup does not change the rules of signal processing. The same rules still apply.
Let’s take the example of a cage failure on a slow-speed bearing. The fundamental train frequency (FTF) for most rolling element bearings is usually between 0.3 and 0.4 times the turning speed of the shaft. This means the shaft must rotate almost three times before the cage has made one revolution. For the FFT process to be able to resolve a single frequency, that frequency must be present in the signature at least four times. This means that the shaft must rotate at least twelve revolutions for the FFT process to resolve the FTF frequency. Therefore, one would need to listen and collect data for 72 seconds to determine the health of the cage.
This is very difficult with a set of headphones and a contact probe. Instead, using the magnetic probe and the analyzer’s ability to record the sound and time waveform is the best method for this type of analysis. That said, cage failures are uncommon, and ultrasound is a better tool for finding raceway faults than vibration, since there is very little force generated with a slow-speed bearing, making it difficult to see with vibration. There are case studies available where technicians have found outer race defects on the main bearing of a Ferris Wheel using ultrasound.
Linear Bearings and Bushings
When a shaft cycles too quickly, conventional vibration analysis can be tricky, even impossible. Linear bearings and some bushings offer just such challenges. Linear bearings are bearings that support linear motion as opposed to rotational motion. Some bushings provide pivot points instead of supporting full rotations of the shaft. These are two common applications that make conventional vibration analysis difficult to impossible. The use of ultrasound in these applications makes assessing the health of these components possible.
The trick is to listen through multiple cycles for scraping or places in the motion where the ultrasonic signature changes. If the cycle is uniformly smooth and quiet, then the bearing or bushing is healthy. If the signature is loud and/or rough in places or throughout the entire cycle, then bearing or bushing needs lubrication or has already experienced adhesive wear, abrasive wear, or fatigue. These applications, though tricky for vibration analysis, are easy for ultrasound.
Would you like to learn more about our Condition Monitoring solutions?
Ultrasonic Assisted Lubrication
Perhaps nothing has so positively affected the world of greasing bearings as much as ultrasound. Finally, a person can know that they have put the correct amount of grease into a bearing. Using ultrasound to grease a bearing allows the user to properly determine if a bearing needs grease, apply the lubricant without compromising the seal, and perform an assessment of bearing condition simultaneously. In the past, the industry has relied on equations (See Figure 1) that account for bearing type and environmental conditions instead of quantitative and qualitative assessments to determine the need for grease.
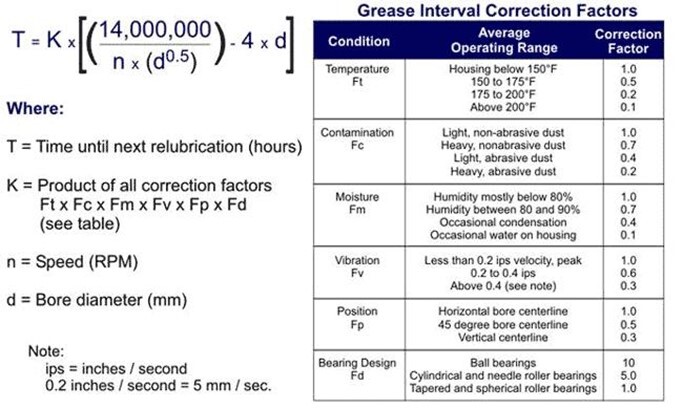
Figure 1: Lubrication Interval Equation (source: Noria Corporation)
Using ultrasound, the evaluation of the need for grease and whether the proper amount has been applied is predicated upon knowing the baseline dB value for that bearing at a given speed and load. When the bearing is defect free, properly lubricated, and operating at the typical speed and load, the dB value of the ultrasonic signature is considered the baseline. Lubrication technicians then should be monitoring the bearing with ultrasound and watching for an 8 dB increase. This is an indication that the bearing requires grease. The technician can then add grease until the last shot of grease starts to raise the ultrasonic levels. This is the correct amount of grease. The technician then monitors the ultrasonic signature for two minutes, ensuring that the levels remain low. If the levels begin to rise, then the bearing has damage and will need replacing.
Finding Pressure and Vacuum Leaks
Few things are as different as finding a leak in a quiet room versus finding that same leak out in the plant. For the most part, industrial environments are “ultrasonically noisy”. This means that there are many sources of competing ultrasonic energy in the typical manufacturing facility. Fortunately, there are easy and effective ways of blocking out this energy. Sound can travel through barriers and solid objects but the thickness of the object that sound can travel through is proportional to the length of the sound wave. The shorter the sound wave, the thinner an object can be to effectively block out ultrasound. Ultrasonic sound waves are very short, and typically, a barrier of 1/8” is sufficient to block out unwanted competing sounds. Things like a notepad, clipboard, rag, or even a gloved hand are great ways to accomplish this. Additionally, most devices come with a rubber focusing cone that not only blocks out competing sounds but reduces the area of focus where the device is listening.
When pinpointing the leak, the analyst must then place the tip of the focusing cone directly at the seal or the pipe fitting being surveyed. The analyst must scan completely around the seal or the fitting. It is quite typical to have a significant air leak on one side of the fitting and not hear it on the other side of the fitting. Once the leak has been pinpointed, move the front of the sensor away from the leak to your established distance to target to record the amplitude of the leak. The recommended distance is 6-10 inches from the front of the sensor (not the front of the cone) to the source of the leak.
Hydraulic Valves and Steam Traps
Using the contact probe to listen to the ultrasonic signature of a hydraulic valve or steam trap as they cycle can be a powerful inspection technique. For both mechanical apparatuses, the analyst is listening for clean cycles. Does the valve or trap rattle when it is open or closed? Is there blow-by when it is closed? Does the valve scrape as it opens or closes? Typically, the analyst should listen to 3-4 cycles to ensure the unit is operating properly and has a clean cycle.
Valve Testing
Valves are used in every industry to control the flow of fluid across the plant. We are often concerned with the condition of these valves, particularly if they are leaking or cavitating. Cavitation in a valve is caused by improper operation of the valve; believe it or not, many valves we use in industry are designed to operate in a fully open or fully closed state, and when we misuse the valve, the areas of high- and low-pressure cause cavitation that can erode the valve seats. Cavitation is the primary root cause of valve leaks. Fortunately, using ultrasound, we can easily hear cavitation in a valve, and by using the four-point test method, we can detect if a fully closed valve is leaking.
Electrical Safety Scans
All too often, the use of ultrasound by non-PdM personnel is an overlooked opportunity. Ultrasound provides for an extremely effective tool for reducing arc-flash incidents in electrical cabinets. Scanning around the seal of the door before opening the door provides the electrical personnel the opportunity to check for arcing, tracking, and corona, all of which increase the arc-flash potential when opening the panel. Arcing, tracking, and corona produce cracking, popping, and sizzling noises in the ultrasonic signature. Any electrical panel with these noises should either be opened by electrical personnel trained in arc-flash potentials and wearing the proper protective equipment or not opened at all while the circuit is energized. It is common to hear that arc-flash potential is greater for circuits over 1,000 volts, which is true. Remember, circuits as low as 240 volts can also produce an arc-flash potential.
Identifying Contact Chatter
Most anyone who has worked in an industrial environment has walked through a motor control center and heard a loud buzzing noise coming from a 480-volt control cabinet. This sound is most likely the hum of the contactor as the coil in the starter and the mechanical spring in the contactor fit with each other. This is called contact chatter and occurs when the electrical coil in the contactor begins to weaken with age. At some point, the coil is no longer strong enough to keep the contacts closed against the mechanical spring that opens the contacts when the coil loses power. As the contacts are forced apart under load, current jumps across the air gap blowing molten silver from the face to one contact onto the face of the other. As this occurs, it makes the contact faces rougher and thus prevents a clean connection when they are in contact. This is the description of the fault progression from the perspective of the contacts. As the strength of the electric coil weakens, the chatter will become apparent to the naked ear and will grow louder with time. When the condition first started, however, it would not have been possible to hear with the naked ear and would have only been detectable using ultrasound. Ultrasound then provides a very early indication of the problem and provides maintenance the longest time window for affecting the repair.
Other Applications
There are a variety of other applications for ultrasound in different industries. For example, ultrasound is used in combination with a tone generator to test the seals around doors and windows in the automotive industry. This technology is used in mining to test and troubleshoot hydraulic systems on mobile equipment. Additionally, we can use contact ultrasound to detect leaks, misalignment, and damage to hydraulic cylinders. Airborne ultrasound has been successfully implemented to diagnose poor lubrication and misalignment in couplings, poor lubrication in drive chains, misalignment in belt-driven applications, gear mesh problems, etc. Since we typically confine ultrasound to the limits of leak detection, this has become the most underutilized technology in industries today, even though it is one of the easiest and most cost-effective to implement.
Common Traps
- Subjective
- Everyone interprets sounds differently
- Data is traditionally qualitative, not quantitative
- Often it is the pattern of the sound and not the sound amplitude (dB) that indicates the presence of a defect
- Difficult to interpret in noisy environments
- • Technicians must be properly trained in the use different techniques to ensure accurate data collection
- Not an exact substitution for vibration
- Can only hear high-frequency defects
Using the ultrasound software can reduce and, in some cases, eliminate these traps by capturing the sound file and waveform, which allows us to interpret the patterns and quantify the ultrasound.
ABOUT ALLIED RELIABILITY
Allied Reliability provides asset management consulting and predictive maintenance solutions across the lifecycle of your production assets to deliver required throughput at lowest operating cost while managing asset risk. We do this by partnering with our clients, applying our proven asset management methodology, and leveraging decades of practitioner experience across more verticals than any other provider. Our asset management solutions include Consulting & Training, Condition-based Maintenance, Industrial Staffing, Electrical Services, and Machine Reliability.
Subscribe to our Blog
Receive the latest insights on reliability, maintenance, and asset management best practices.